
Price Action Toolkit: MTF Highs and Lows
Traders often use the highs/lows of certain trading sessions or time periods within their analysis. The Price Action Toolkit plots the highs/lows and the opening price of certain periods and sessions with text labels. Below, we’ve outlined how each setting and feature works.
Settings
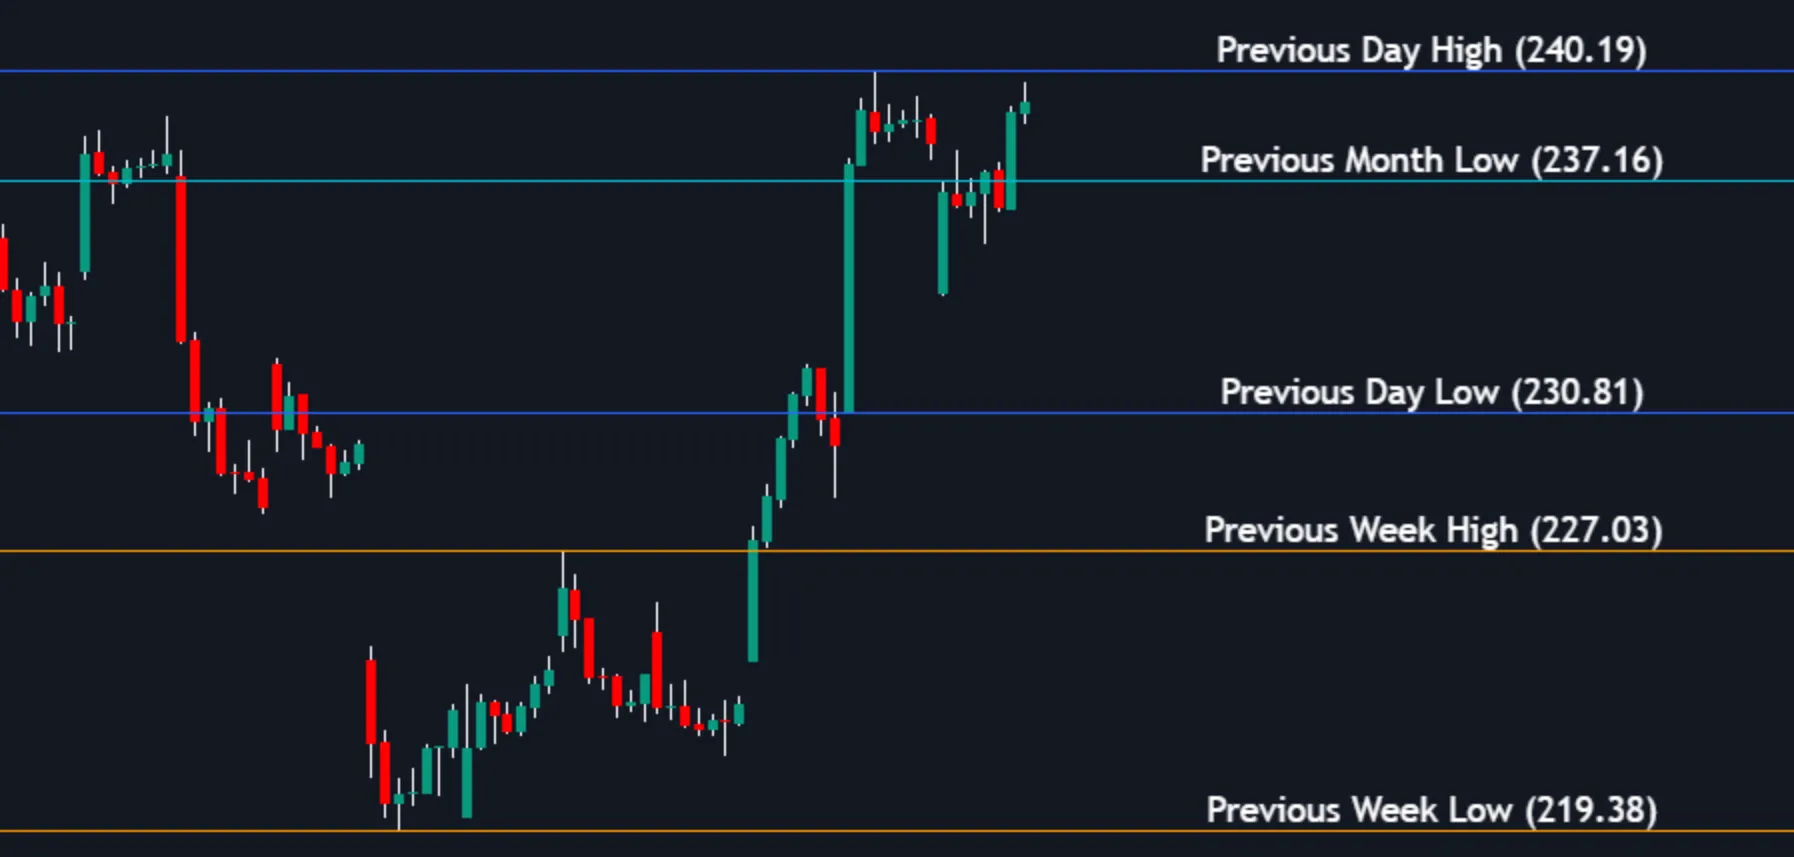
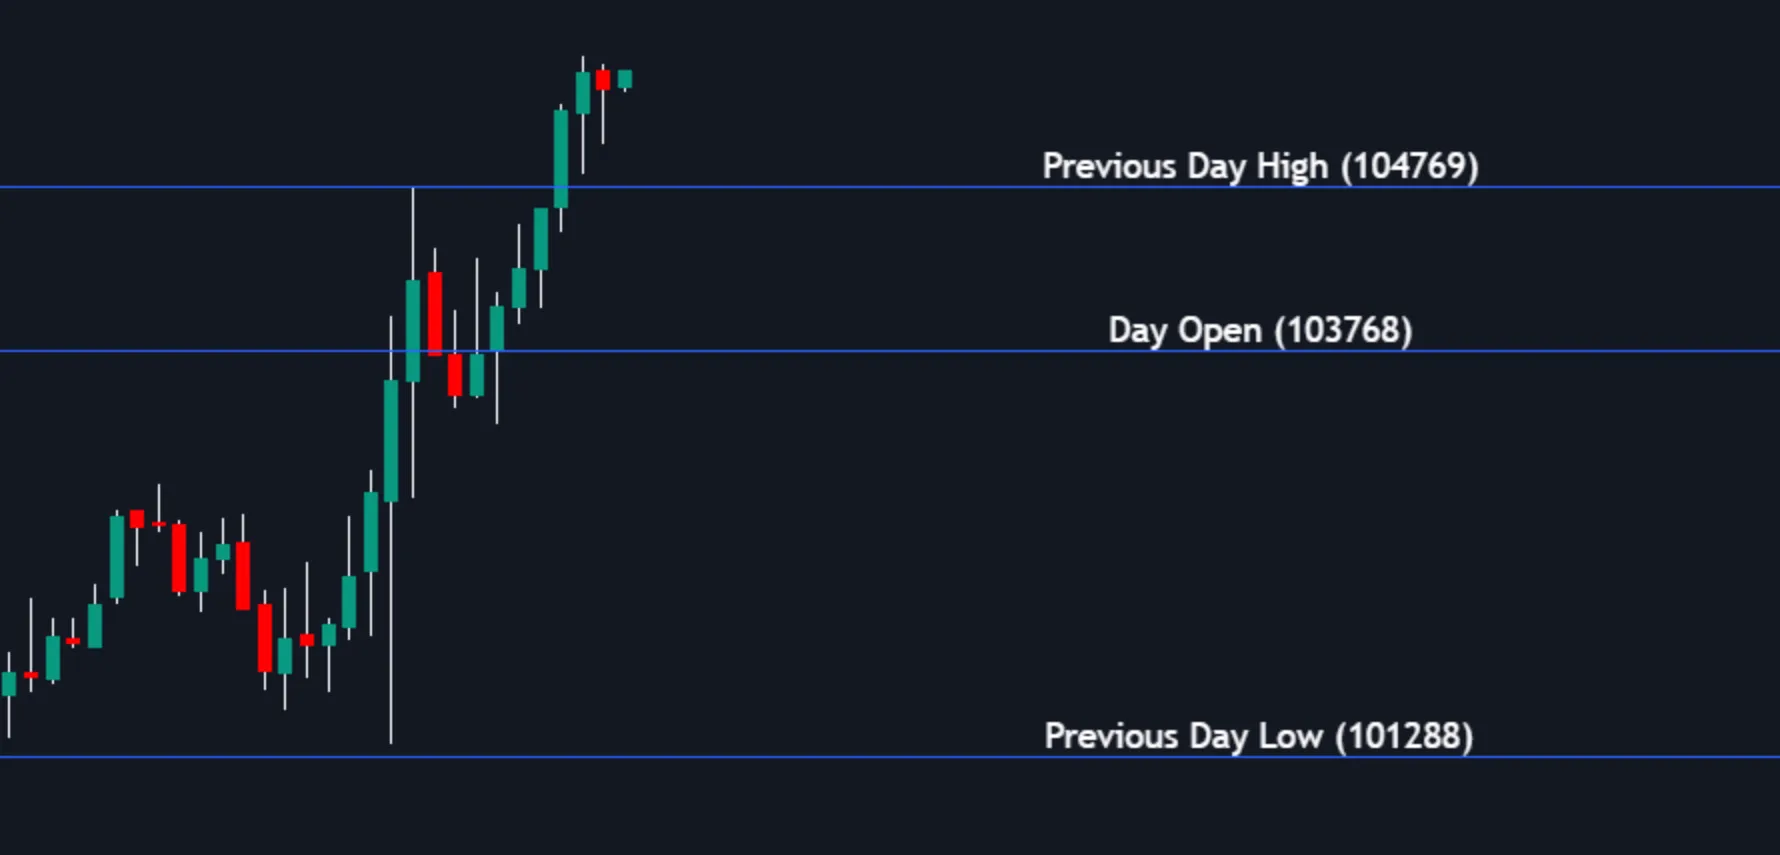
Previous Day
The Previous Day High (PDH) and Previous Day Low (PDL) will be plotted when enabled. The Previous Day Open (PDO) will also be plotted if enabled. The PDO is the asset's opening price from the previous week.
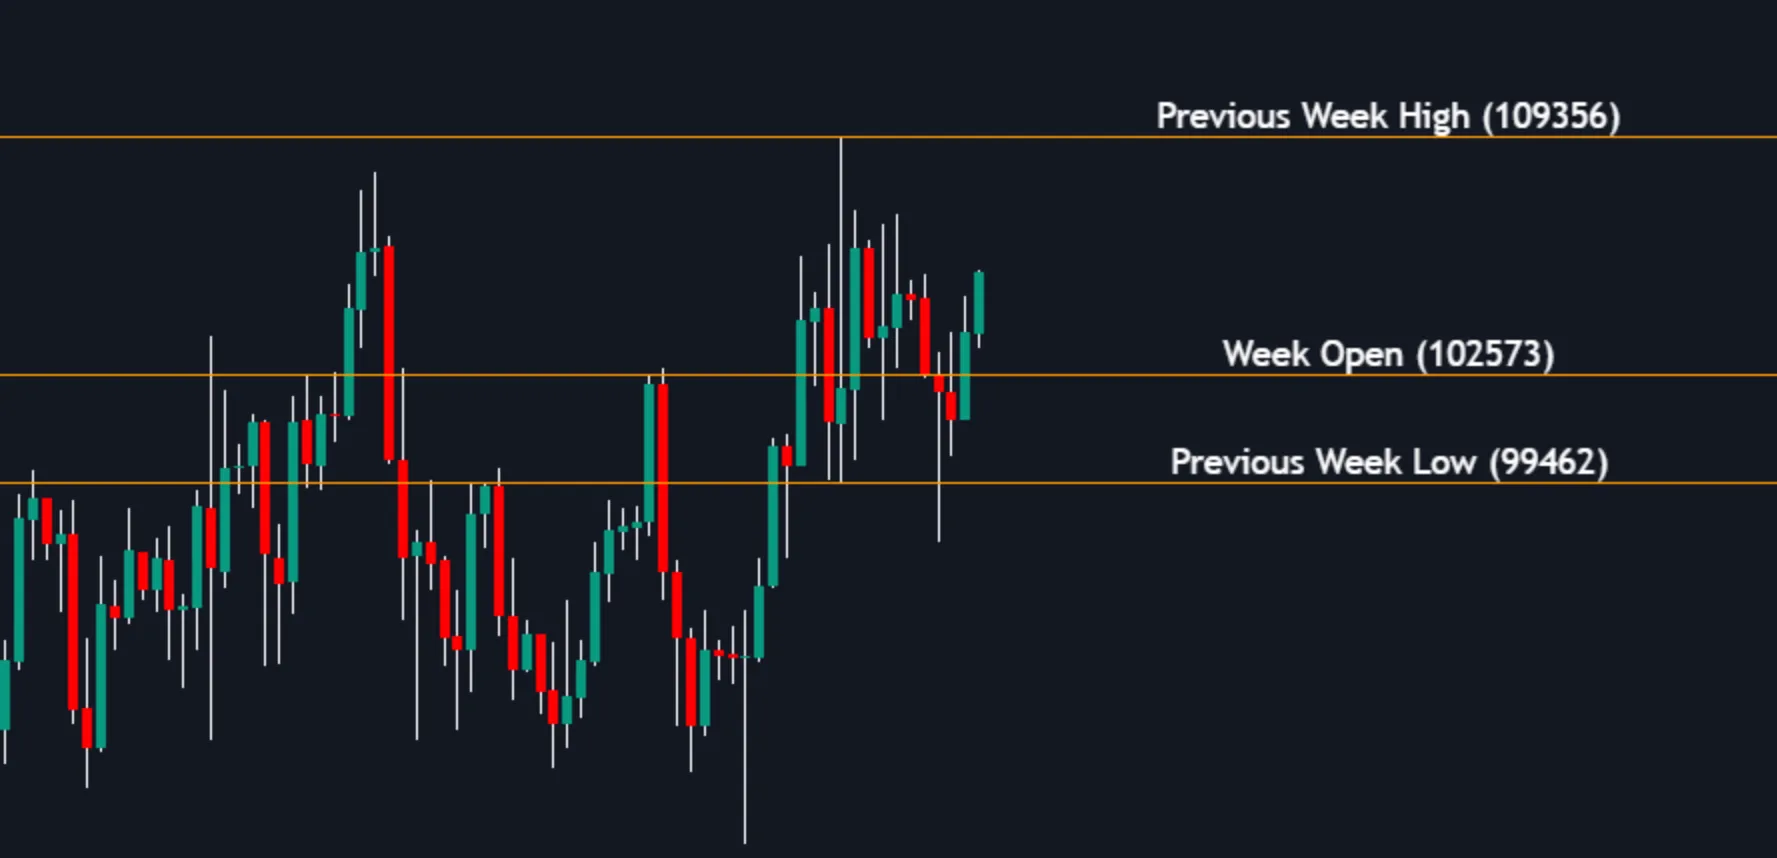
Previous Week
The Previous Week High (PWH) and Previous Week Low (PWL) will be plotted when enabled. The Previous Week Open (PWO) will also be plotted if enabled. The PWO is the asset's opening price from the previous week.
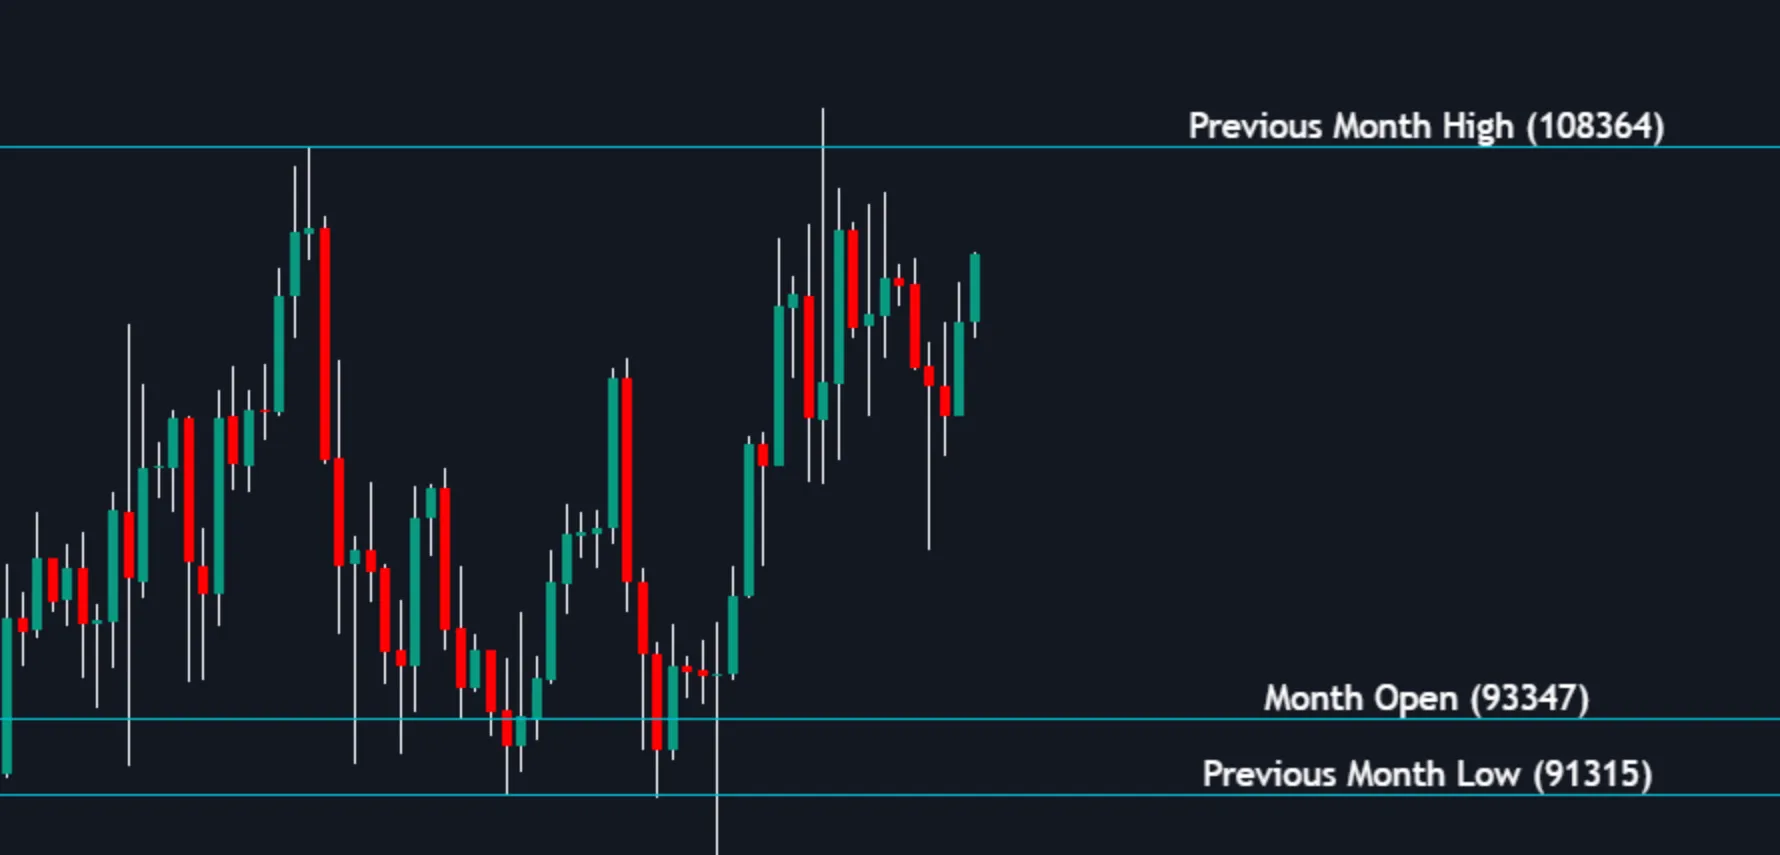
Previous Month
The Previous Month High (PMH) and Previous Month Low (PML) will be plotted when enabled. The Previous Month Open (PMO) will also be plotted if enabled. The PMO is the asset's opening price from the previous week.
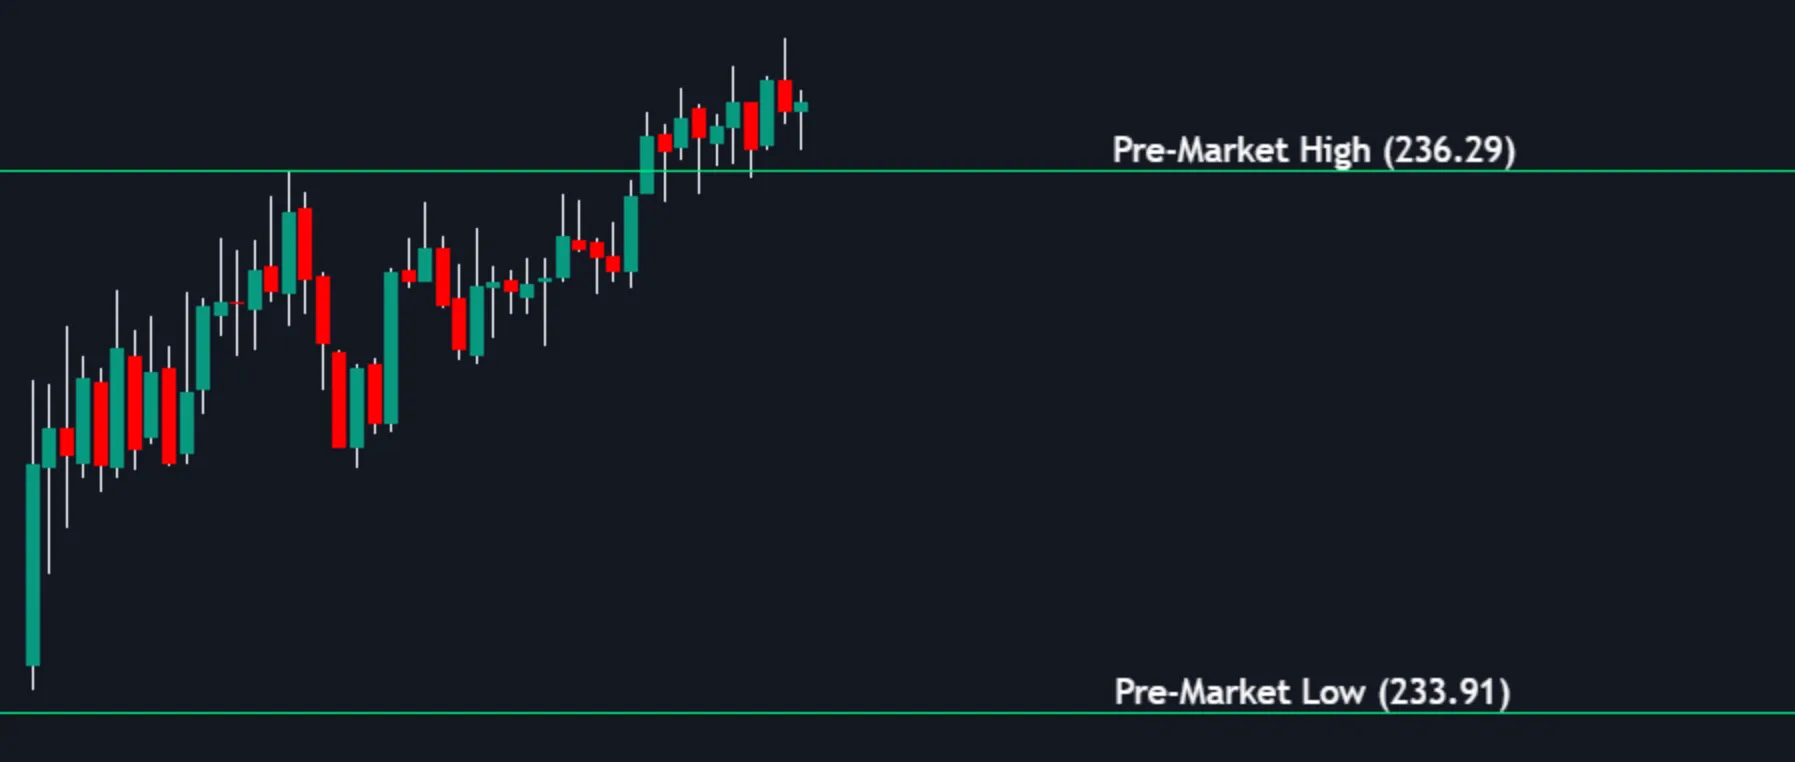
Pre-market
The pre-market high/low will be plotted when enabled. This setting only works on assets that have pre-market data, such as stocks. The levels will also only be plotted throughout the day’s trading session and will be hidden once the after-market session begins.
Line Customization
You can customize how the lines are plotted for the levels you selected, choosing between:
- Solid lines
- Dashed lines
- Dotted lines
Use Shorter Titles
When enabled, the titles of each level will be shortened.
- Previous Day High → PDH
- Previous Day Low → PDL
- Day Open → DO
- Previous Week High → PWH
- Previous Week Low → PWL
- Week Open → WO
- Previous Month High → PMH
- Previous Month Low → PML
- Month Open → MO
Shorter Lines
Enabling this setting will not extend the lines to the right and left. Instead, lines will start at their origin and extend slightly past the current candle.