

See Price Action Clearly
Read The Market With Confidence
Master the VWAP Wave System and see the market for what it really is. Whether it's price discovery or value, the toolkit strips away confusion and gives you clear insights before you place a trade.
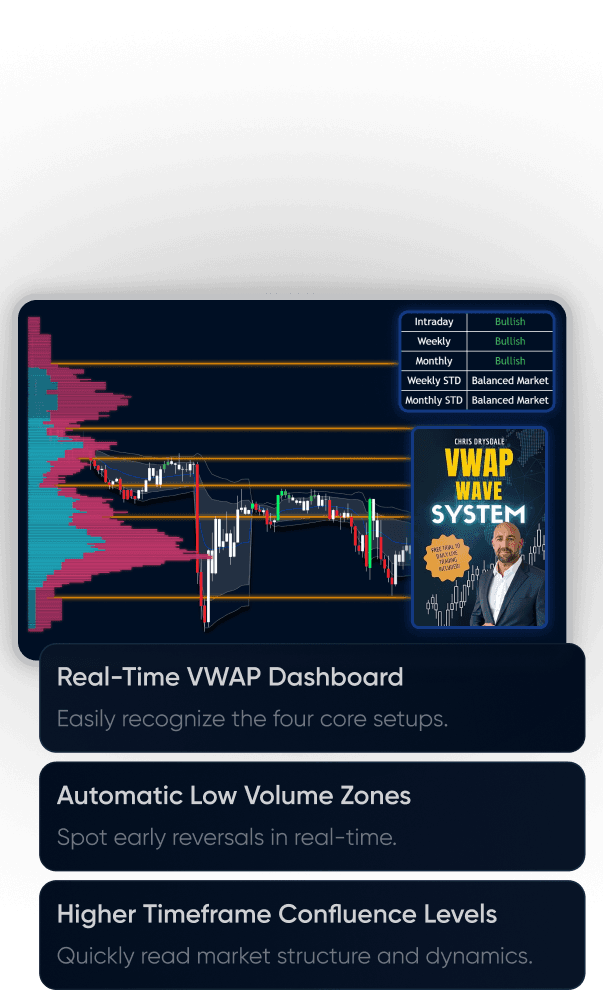
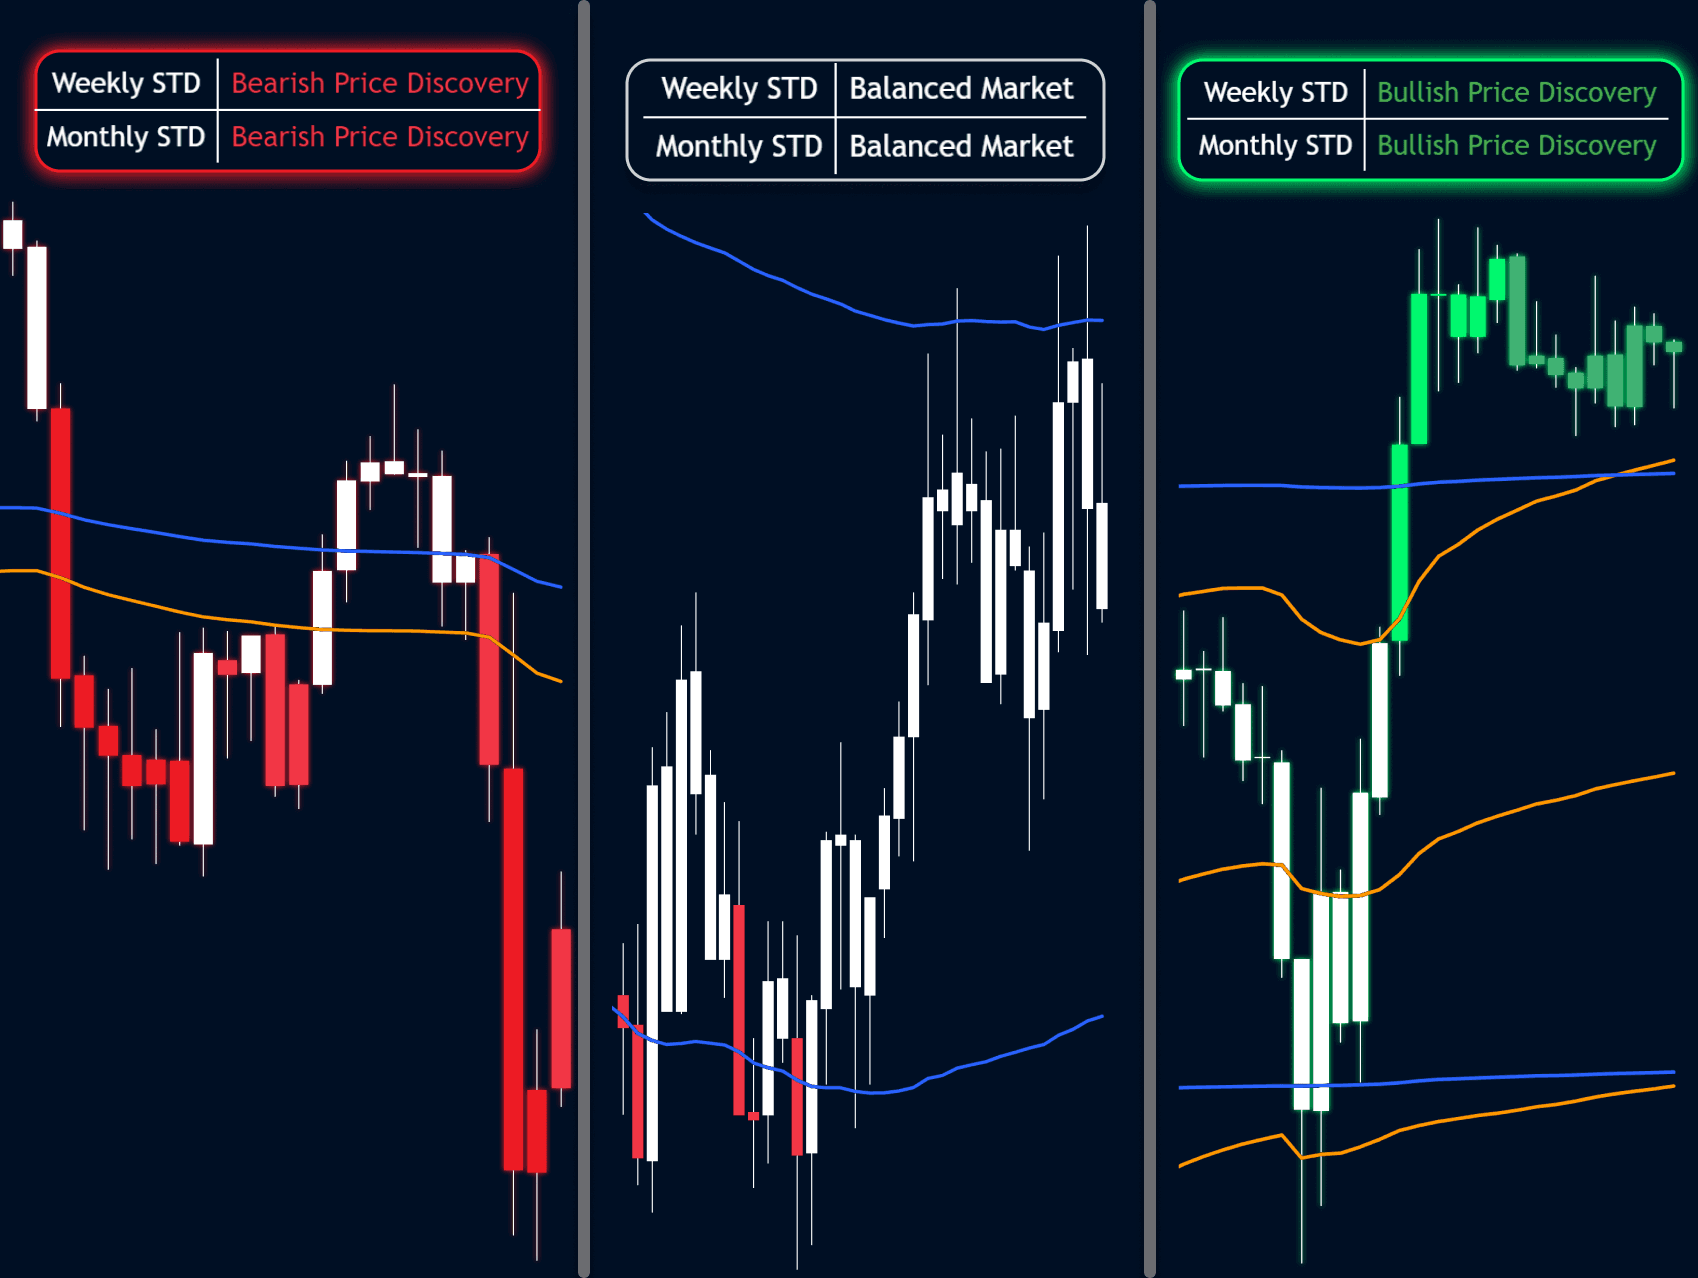
VWAP Dashboard
Easily recognize the four core setups and know instantly if the market is in discovery, balanced, or fading.
Initial Balance (IB) Levels
Track IB highs, lows, and midpoints automatically—with break and retest labels showing you the key moments in real time.
Composite Volume Profile
See the bigger picture with a multi-session Volume Profile and low-volume zones that reveal hidden reversal points.
Filter Out Noise
Trade When It Matters
Spot high-probability setups with a high-definition session volume profile, low-volume zones that expose reversal points, and a checklist that keeps every trade disciplined.
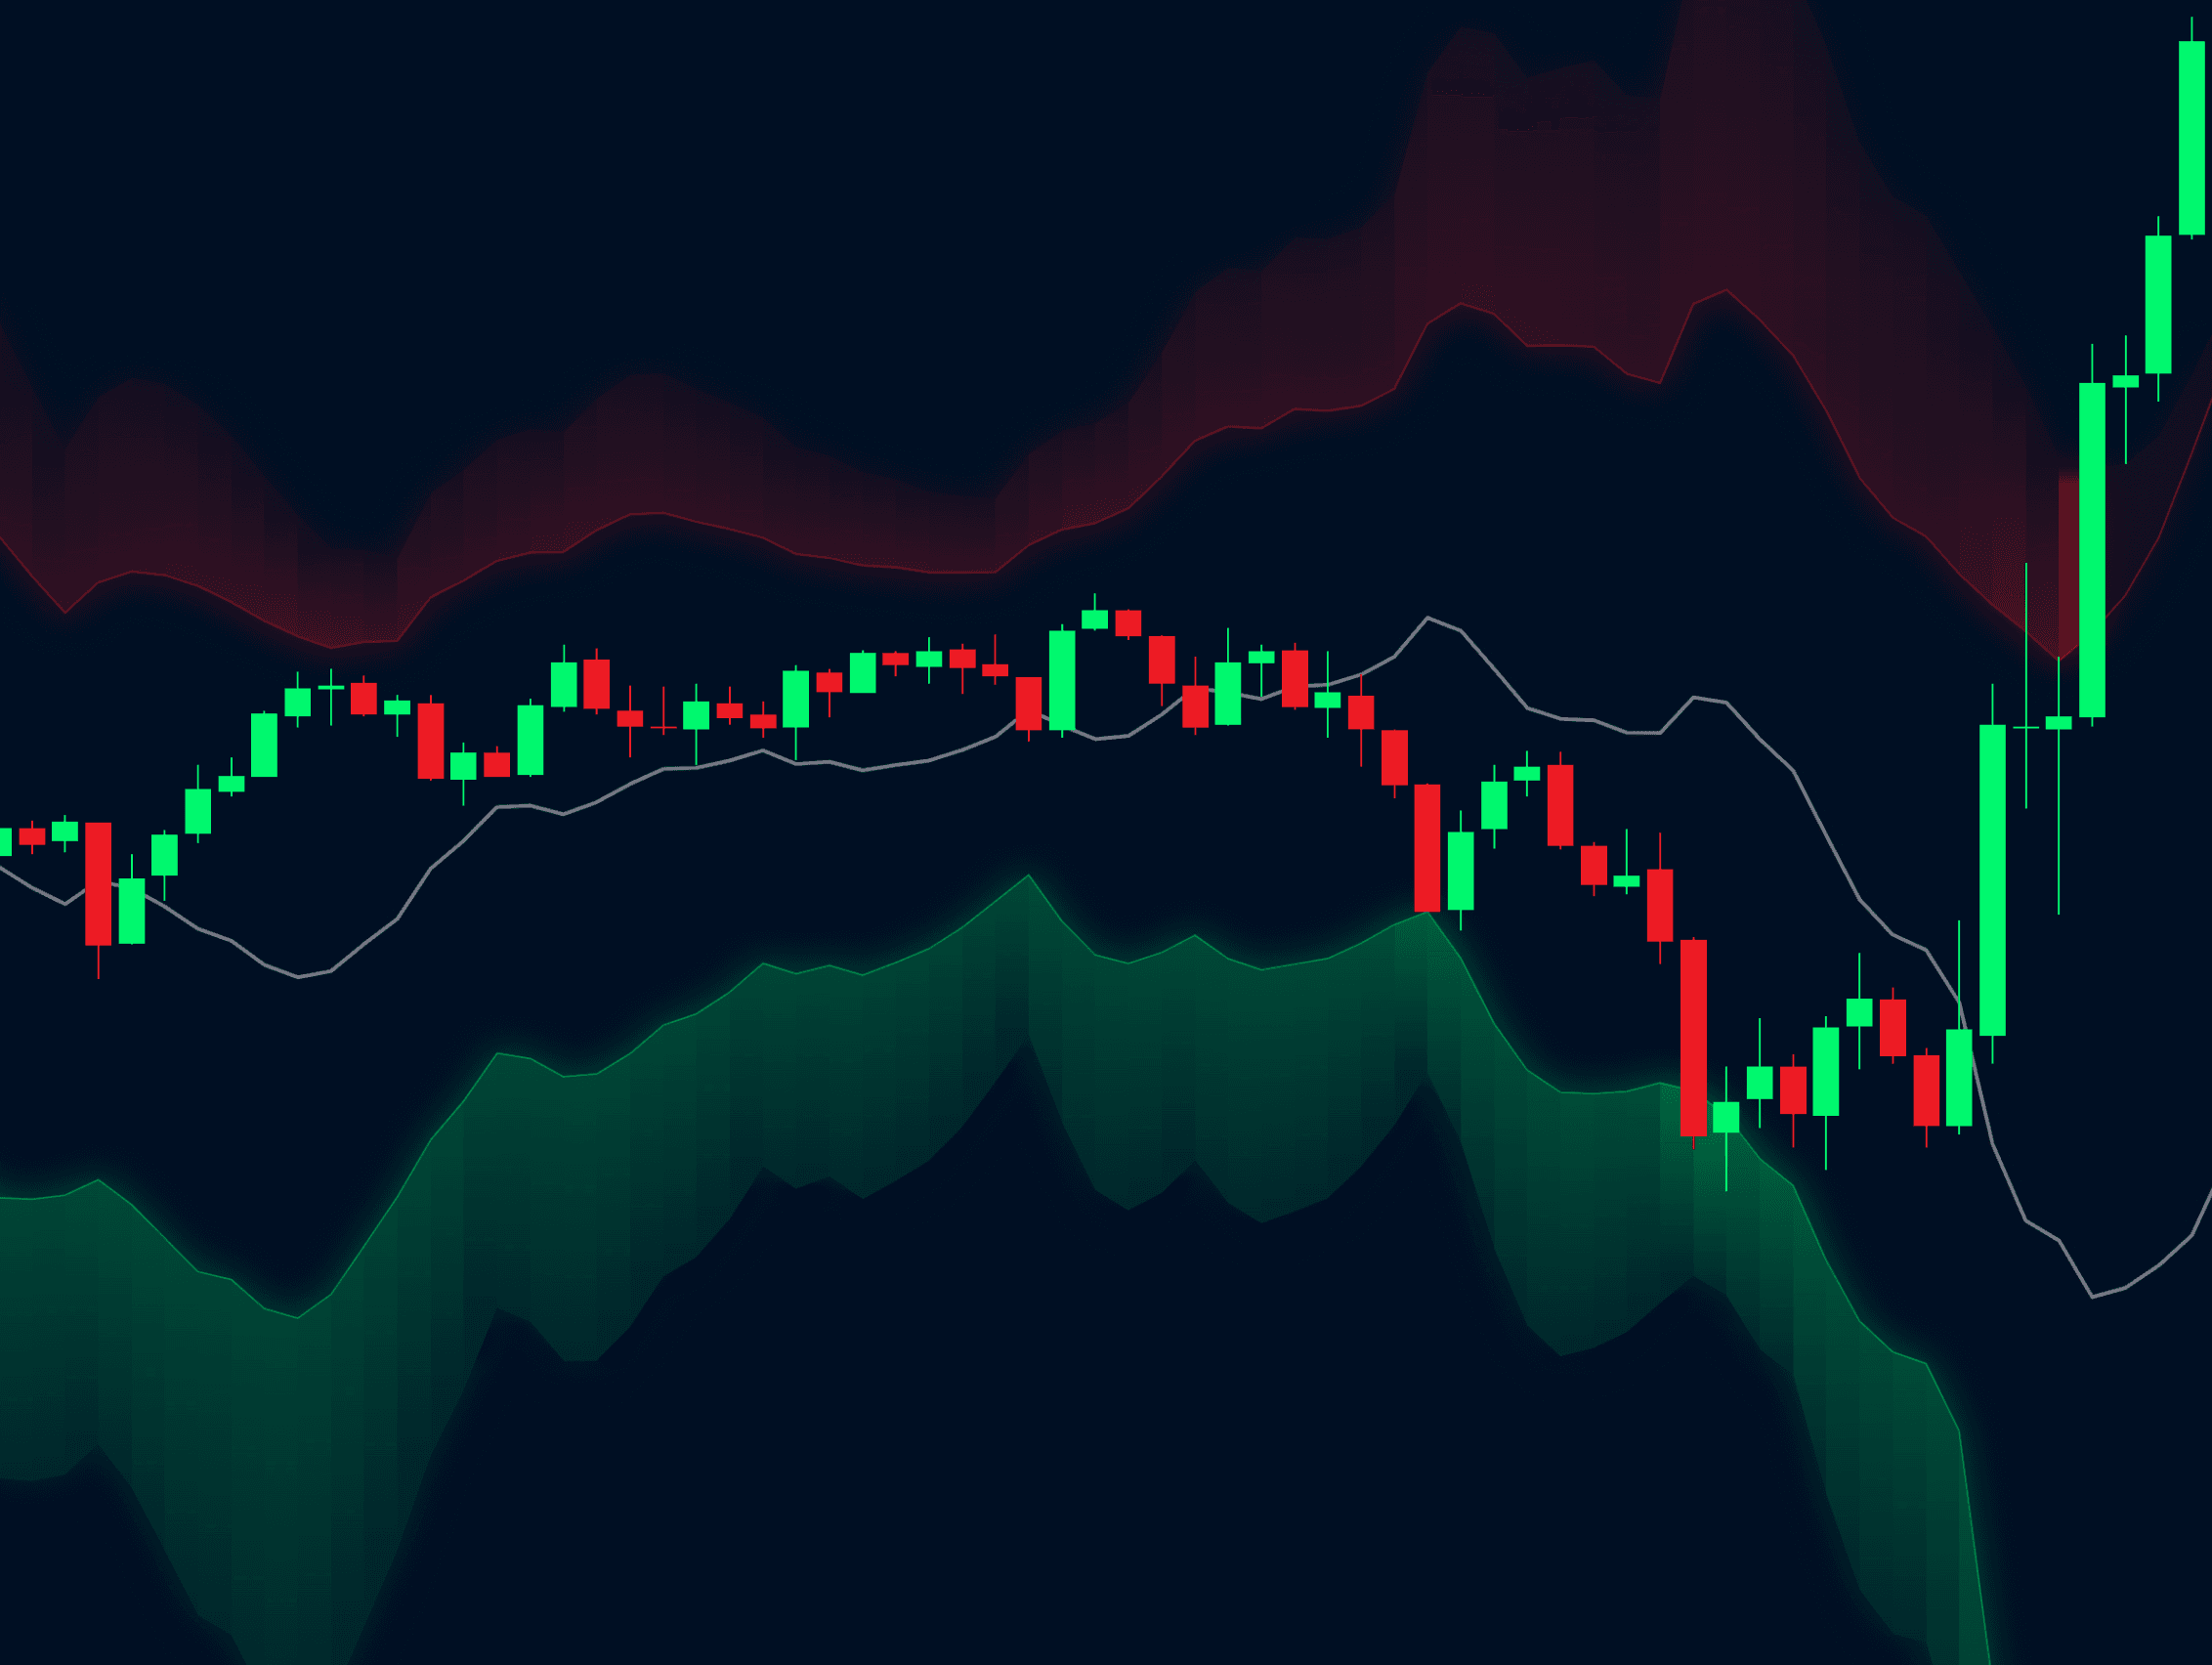
Price Wave Deviations
Spot statistically overbought and oversold zones instantly with adaptive machine learning bands.
Low Volume Zones
Keep previous session low-volume zones on your chart and let retest/break labels call out the turning points.
Session Volume Profile
See exactly where volume built up and thinned out during each session, including the POC, VAH, and VAL levels.
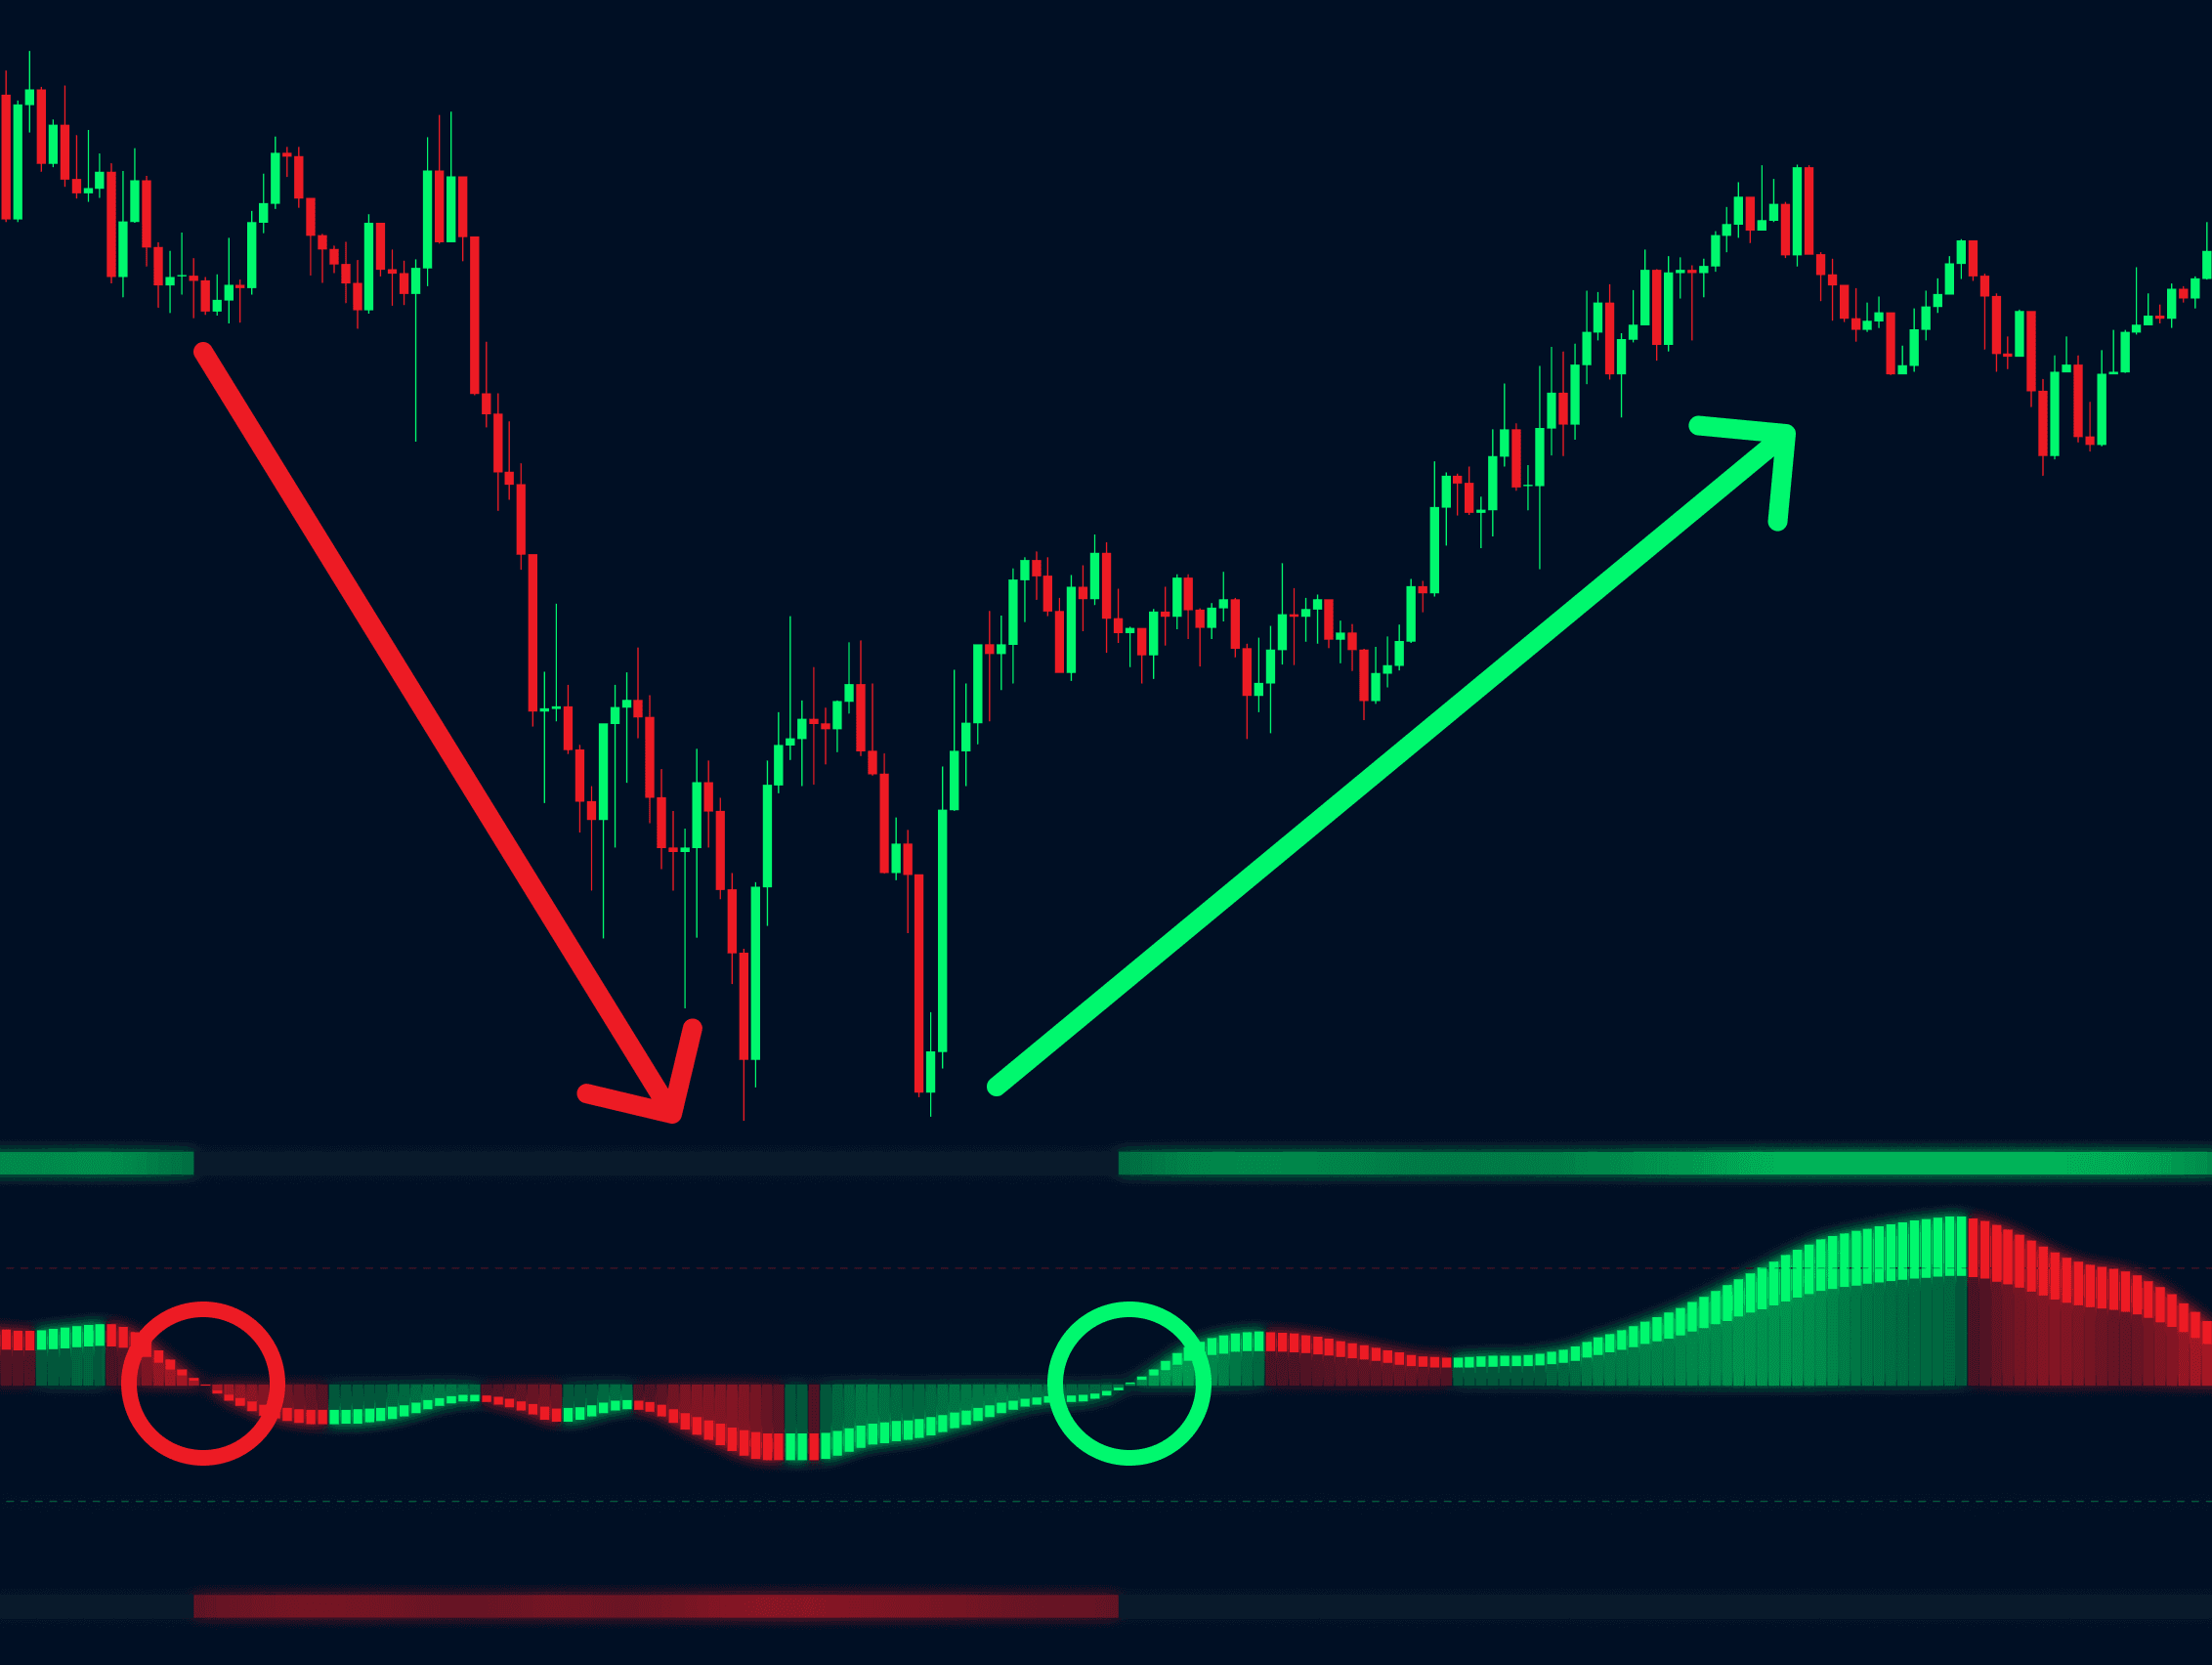
Read Order Flow
Analyze Volume Participation
Confirm price action with cumulative volume delta, divergence detection, absorption candles, and volume momentum.
Cumulative Volume Delta
Visualize net buying and selling activity to confirm whether price movement is supported by real participation.
CVD Divergences
Identify when price pushes higher or lower without volume confirmation, highlighting exhaustion.
Absorption Candles
Spot candles where price continues moving while volume pressure shifts against it, signaling absorption.
Transparent Pricing
Simple, Transparent Pricing
Every tool you need to trade the VWAP Wave System.
Get Set Up In Minutes
The VWAP Wave System Indicator Suite runs on TradingView—a free platform used by millions.
Frequently Asked Questions
Frequently asked questions about the VWAP Wave System Toolkit.
